Conclusion
Maps have walked hand-in-hand with geography throughout the ages. As geographical knowledge has expanded, their handshake has tightened. They are now inseparable. Looking back over four hundred years, one appreciates the journey they have taken together.


[Above] Christophe de Savigny, ca. 1530–1608. “Geographie.” Woodcut engraving, 40.2 × 31 cm. From his Tableaux: Accomplis de tous les arts liberaux: Contenans brieuement et clerement par singuliere methode de doctrine, vne generale et sommaire partition des dicts arts, amassez et reduicts en ordre pour le soulagement et profit de la ieunesse (Paris: Par Iean & François de Gourmont freres, demeurants ruë Sainct Iean de Latran, 1587) [Rare Books Division]. Reference: Shirley, Mapping of the World, 159.
Geographically, the world in this sixteenth-century map is still very much a work in progress. What looks like Australia in the Pacific Ocean is really the mythical Southern Continent that would become a major goal of European explorers through the voyages of Captain James Cook in the 1770s. French humanist Savigny may have been encouraged to include the landmass by the discovery of the Solomon Islands in that general area by the Spanish explorer Alvaro de Mendaña de Neira (1542–1595?) in 1568.
The chart, or logic tree, presents the subject of geography in all of its basic hierarchical branches, dividing them by “superfice” (in English, “superficies” or surface) categories and qualities. For example, land is either a continent or an island; water is either flowing or standing. “Nouveau” land is labeled the “Northern,” “West Indies,” and “Southern or Magellanique” (after Ferdinand Magellan). Latitude is determined by the meridian of the sun, longitude by the motion of the stars; the only named astronomical instrument is the astrolabe, which dates from classical antiquity. Around the border are boxes of text, alternating with related scenes, that explain the gradual division of the realms of the earth into smaller and smaller units of measurement (provinces into regions, lands into acres, etc.), ending with “Les Espans en Doigts” (hands into fingers).
[Above] Richard Blome, d. 1705. “Geography: To the Rt. Honble. George Berkeley, Ld. Berkeley . . . anno Dom. 1678.” Copperplate engraving, with added color, sheet 38 × 24 cm. Plate 104 from his The Gentlemans Recreation . . . (London: Printed by S. Roycroft, for Richard Blome . . . , 1686) [Historic Maps Collection]. Reference: Shirley, Mapping of the World, 479.
One hundred years later, in this seventeenth-century map, the west coast of Australia has been added to the world, following the explorations of Dutchman Abel Janszoon Tasman (1603?–1659). A finer, more accurate chiseling of the shape of the continents has occurred, though California is now an island. But the tree of geography remains virtually unchanged, except that the last divisions of measurement are “Feet into Inches” and “Inches into Barly-corns.” (A barleycorn was an old unit of length equal to one-third of an inch.)
Still, as we know now, scientific inquiry had begun in earnest—Francis Bacon and like-minded others had sparked a new investigative approach—and, as a consequence, the first thematic maps had started to appear during the later part of this century. We have seen what would follow in the eighteenth and nineteenth centuries, preparing for their dominant role in the twentieth.
Here at the beginning of the twenty-first century we confront this 3-D concept of the world (see below). We have found and fitted in the geographical puzzle pieces of the planet and have begun turning our attention beyond Earth’s horizon to the uncharted universe. Cartographically, in many respects, we must start at the beginning with basic reference maps that name “places” (stars, planets, etc.), locate them on a grid, and exhibit some of their topographic features. Thematic maps, of course, will play their essential part. [The historical development of GIS (Geographic Information System) technology and its dramatic effects on geography/cartography is treated in a "perspective" essay by Tsering Wangyal Shawa, Princeton's GIS librarian, in the volume published to accompany this exhibtion. See more about the book here.]
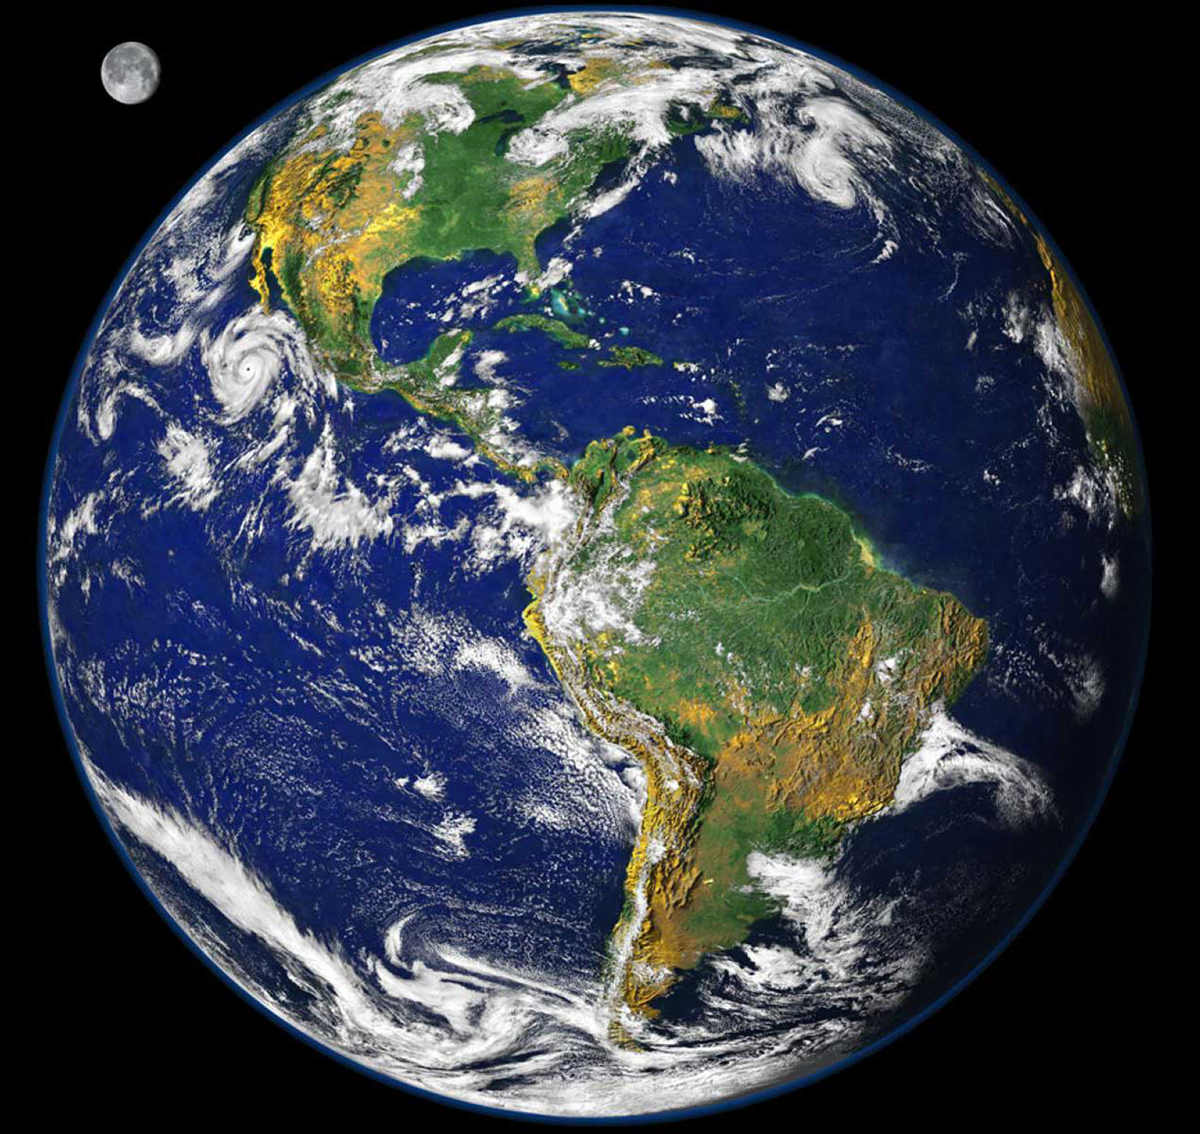
Earth seen from space, with the moon in the background. From NASA.

A thematic map of the infant universe created from five years of WMAP (Wilkinson Microwave Anisotropy Probe) data. The image reveals 13.7-billion-year-old temperature fluctuations (shown as color differences) that correspond to the seeds that grew to become the galaxies. This image shows a temperature range of ± 200 microKelvin. From NASA / WMAP Science Team.
Yes, thematic maps are ubiquitous now. Think Google Maps. A weather map helps us plan for tomorrow, a geological map suggests where to explore for oil, a census map aids representative reapportionment. Obviously, it was not always so. The purpose of maps has followed a natural evolution—from where to what to why—from telling us where places are geographically located, to uncovering subject content of physical and social space, to forecasting and/or postdating events to illustrate cause and effect. As tools, thematic maps help men and women make decisions for today and plan for tomorrow, wherever that may be.
Think of a topic and a place. By now you know: “There’s a m/app for that.”
—John Delaney, Curator
Historic Maps Collection
Princeton University Library