Hydrography
Hydrography, generally defined, is the study of the depth and movement of bodies of water—streams, rivers, lakes, oceans—and of their coastal land areas, particularly in the context of navigation.

Portrait of Athanasius Kircher. From his Romani collegii Societatus [!] Jesu musaeum celeberrimum . . . (Amsterdam: Ex Officina Janssonio-Waesbergiana, 1678) [Rare Books Division].
Often compared to Leonardo da Vinci for the breadth and depth of his interests, Kircher was a German Jesuit scholar who spent most of his life in Rome. His numerous publications amounted to encyclopedic works on a wide range of topics, including magnetism, Egyptology (and hieroglyphics), geology, and music theory. He examined the blood of plague victims under a microscope, concluding the disease was caused by microorganisms; he constructed a magnetic clock; he designed a cat piano which would drive spikes into the tails of cats so they would yowl to specified pitches (though he is not known to have constructed it!). He was the first scientist to support himself from his writings. The Encyclopædia Britannica describes him as a “one-man intellectual clearinghouse for cultural and scientific information.”
[Below] “Tabula geographico hydrographica motus oceani currentes. . . .” Copperplate map, 28.1 × 53.7 cm, within larger border. From Kircher’s D’onder-aardse weereld in haar goddelijk maaksel en wonderbare uitwerkselen aller dingen . . . , 2 vols. in 1 (Amsterdam, 1682) [Rare Books Division]. Reference: Shirley, Mapping of the World, 436.
Landmark map of ocean currents, first published in Kircher’s Mundus subterraneus (1665). Note, though, that there are no arrows to indicate direction. Kircher theorized that there was a worldwide underground network of canals and caverns through which water flowed (via tidal flux and reflux), connecting to counterparts on the surface, such as rivers and currents. He has drawn dotted lines where he believes tunnels link the Caspian Sea, Black Sea, and Persian Gulf, and pass through the Sinai Peninsula, site of today’s Suez Canal. The small, circled dots indicate whirlpools where water is sucked down into the subterranean system; the largest one, not shown, is at the North Pole.


Eberhard Werner Happel, 1647–1690
Eberhard Werner Happel was a German journalist and author of formulaic historical fiction and popular treatises on natural science.
“Die Ebbe und Fluth auff einer flachen Landt-Karten fürgestelt” [Ulm: s.n., 1675]. Copperplate map, 20 × 28 cm [Historic Maps Collection]. Reference: Shirley, Mapping of the World, 468.
One of the earliest thematic maps, showing ebb and flow of the earth’s waters—but, again, no directions. Obviously, this is a derivative of Kircher’s 1665 map, but it is more defined and includes a man-made feature, the Great Wall of China. Both maps are very early attempts to rectify actual mariners’ observations with semiscientific theory.
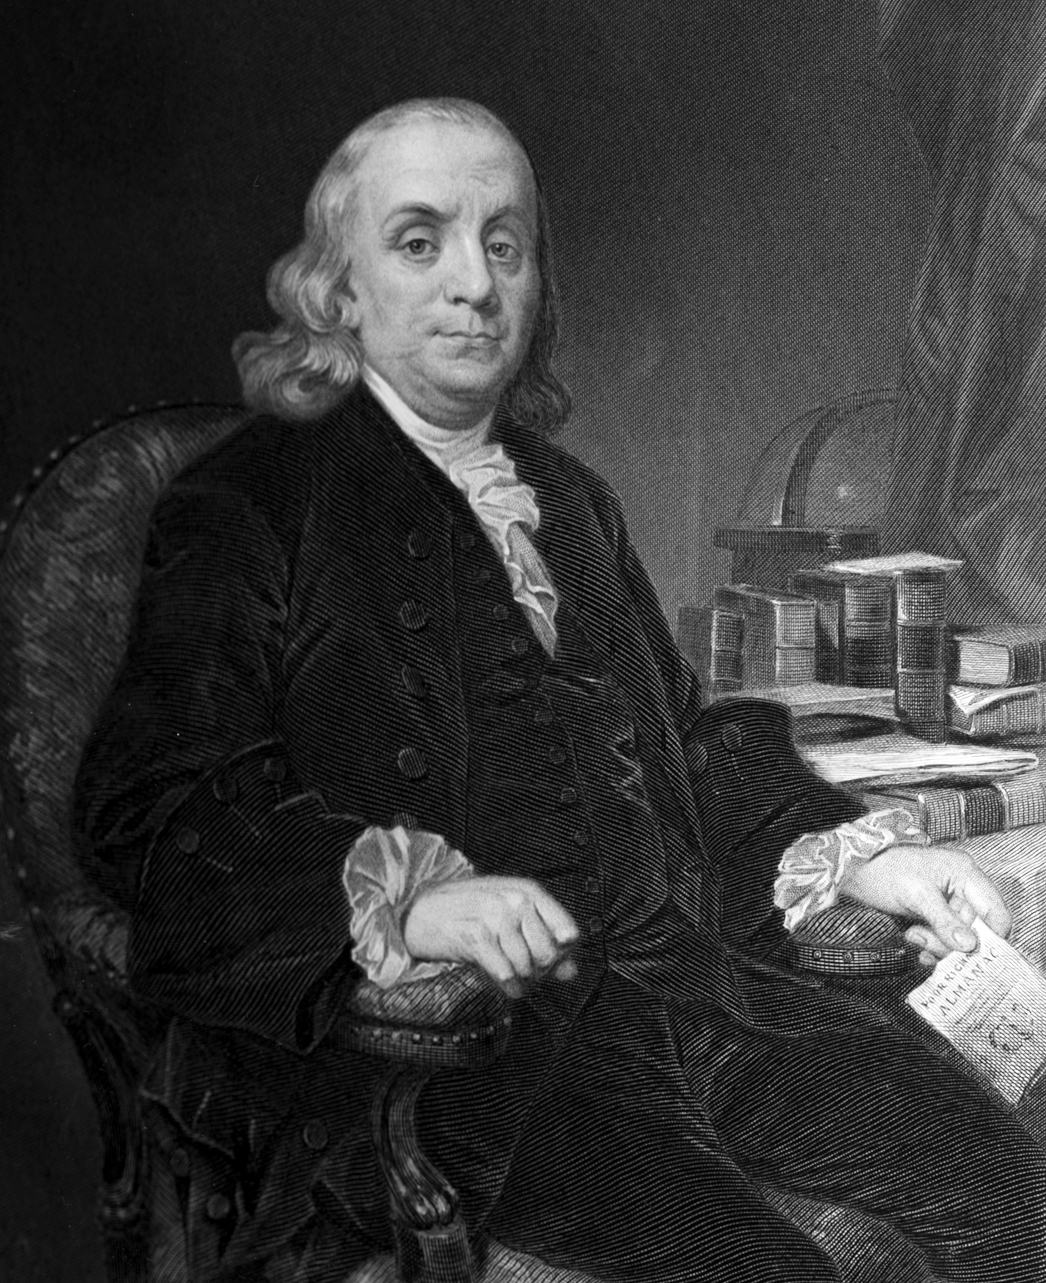
Portrait of Benjamin Franklin. From vol. 1 of Evert A. Duyckinck’s Portrait Gallery of Eminent Men and Women of Europe and America (New York: Johnson & Miles, 1873) [General Library Collection].
One might have expected that a naturally curious, scientifically minded man like Benjamin Franklin would one day help to create an important map. That it is one of the earliest American thematic map productions only adds to our growing fascination with this colonial jack-of-all-trades.
As early as 1726, in a crossing of the Atlantic from London to Philadelphia, Franklin noted effects of an ocean current in his journal. In 1768, in his role as deputy postmaster of the British colonies in North America, Franklin began hearing complaints about the practical implications of this current: something was delaying the New York mail. Boston customs officials observed a two-weeks’ difference in the arrival times of ships sailing east to west from England to New York versus England to Rhode Island. He consulted a cousin, Nantucket mariner Timothy Folger, about the problem. Folger was certain that the Gulf Stream was the culprit, for Rhode Island captains were aware of the current through their whaling activities, whereas those of the English packet boats were not. Franklin asked Folger to add the location and dimensions of this current to an available chart so that he could communicate the information to the English sea captains.
Published in England circa 1768, the map was mostly ignored by the stubborn English navigators. Though few copies of this English version seem to have survived (Library of Congress has one), Franklin also had the chart printed in France around 1785, and he published it again with his article “Sundry Maritime Observations” in the Transactions of the American Philosophical Society in 1786. However, it took a long time before the British followed Franklin’s advice on how to avoid fighting this current.
Franklin’s first mention of the Gulf Stream. In his letter to Dr. Pringle, Franklin discusses the Admiral Bartholomew De Fonte myth of a Northwest Passage, which he believes has merit—and also touches upon the prevailing winds:
The Trade Wind blowing over the Atlantic Ocean constantly from the East, between the Tropics, carries a Current to the American Coast, and raises the Water there above its natural Level. From thence it flows off thro’ the Gulf of Mexico, and all along the North American Coast to & beyond the Banks of Newfoundland in a strong Current, called by Seamen the Gulph Stream. . . . [T]he Waters are mov’d away from the North American Coast towards the Coasts of Spain & Africa, whence they get again into the Power of the Trade Winds, & continue the Circulation [Franklin’s underlining].

Section of an autograph letter by Franklin, dated 27 May 1762, to Sir John Pringle, who would become president of the Royal Society in 1772 and physician to King George III in 1774 [Andre De Coppet Collection, Manuscripts Division].

“Remarques sur la navigation de terre-neuve à New-York afin d’eviter les courrants et les bas-fonds au sud de Nantuckett et du Banc de George” (Paris: Chés Le Rouge, rue des Grands Augustine . . . , [ca. 1785]). Copperplate map, 32 × 36 cm on sheet 46 x 61 cm [Historic Maps Collection].
First map of the Gulf Stream, which gave it its name. It is often referred to as the Franklin–Folger map because of Folger’s major role.
Prussian-born cartographer August Petermann spent seven years (1847–1854) in London, where he founded his own business in 1850. He was also a fellow of the Royal Geographical Society. [For more on Petermann, see his entry in the Landmark Thematic Atlases section.]
[Below] “To Her Most Excellent Majesty Queen Victoria This Hydrographical Map of the British Isles, Exhibiting the Geographical Distribution of the Inland Waters” (London: published for the author by Wm. S. Orr, 147, Strand, July 1849). Engraved map, with added color, 81 × 53 cm [Historic Maps Collection].
One of the most important products from Petermann’s London years and probably the earliest and largest such map devoted to Great Britain’s hydrography. Petermann first presented this map at the annual meeting of the British Association for the Advancement of Science, held at Swansea, Wales, in August 1848. It identifies 1,550 rivers, 440 lakes and ponds, and 40 waterfalls. The fall of the principal rivers and the elevation of the major canals are illustrated in the inset. Of the rivers that drain more than five hundred square miles, twenty are in England, ten in Scotland, and ten in Ireland. According to Petermann, the length of the rivers and the area of their basins are drawn from “careful Original calculations.”

Georg Bauerkeller, fl. 1830–1870
Georg Bauerkeller was a relief cartographer and globe maker.
[Below] “Hydrogr. Karte von Europa” (Paris: Farbendruck und Prägung von Bauerkeller et Cie, ca. 1845). Embossed lithograph map, 47 × 59 cm [Historic Maps Collection].
This is an extremely rare and early map of European hydrography, employing an unusual printing process. (No copies of it are listed in the WorldCat database, which represents the holdings of more than ten thousand libraries worldwide; a title search retrieves no results through Google.) The orange dots identify the major towns and cities of the countries.
