Unlocking Creativity: Making Data Physicalizations
PowerPoint or instructional video? Bar graph or pie chart? Choosing the right tool to present data is important, but what about bringing that digital data into the physical world? The "Data Driven Creativity: Making Data Physicalizations" Wintersession, held at the Princeton University Library (PUL) Makerspace, explored just that by taking participants through the complete process of bringing their data to life.

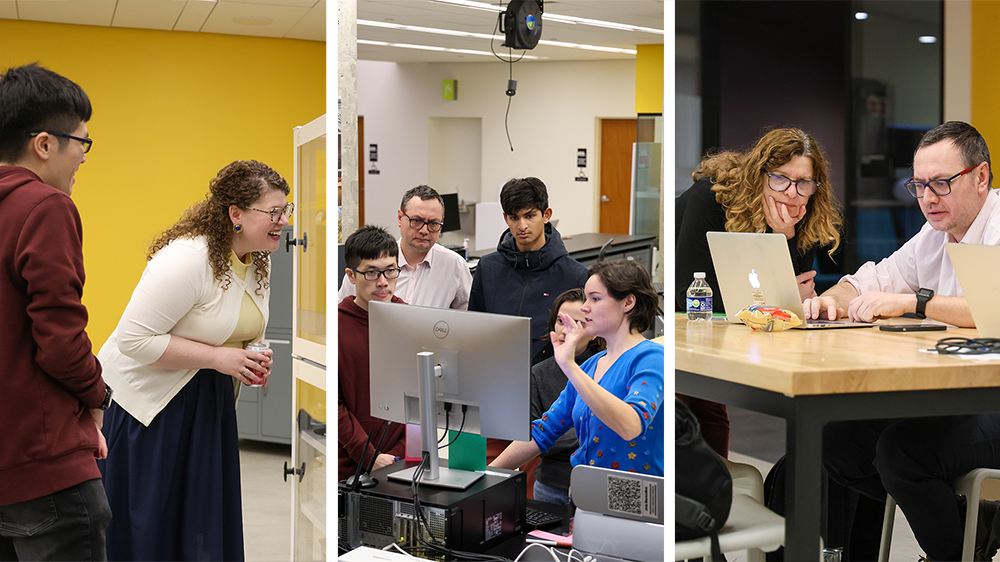
From left: Sarah Reiff-Conell watches an in-progress 3D print with a session attendee, Ariel Ackerly shows attendees how to use a smart cutting machine, and Ofira Schwartz-Soicher works with Bertrand Reau on his physicalization. Photo credits: Brandon Johnson.
The brainchild of Social Sciences Data and Sociology Librarian Ofira Schwartz-Soicher, Research Data Management Specialist Sarah Reiff Conell, and Makerspace Specialist Ariel Ackerly, this workshop was rooted in interdisciplinary collaboration. "We wanted to learn about the history of data physicalization, which was a relatively new concept for all of us," explained Schwartz-Soicher. "We knew we had to provide some historical context for participants and prepare instructional materials, especially considering the varied experience levels with data."
The two-part series kicked off with a presentation on the history and concept of data physicalization, setting the stage for participants to delve into the creative process. Ackerly added, "We held a brainstorming period where participants decided upon the datasets they would like to physicalize, the type of physicalization they would like to create, and thought through the logistics — things like what's possible with the given tools; what materials might they need; how should they prepare their data or files ahead of time."
The tour of the Makerspace and its array of materials and equipment provided inspiration for the participants to choose from when deciding how to represent their data.
For Bertrand Reau, a visiting researcher at Princeton University’s Department of Sociology, Chair Professor at the National Conservatory of Arts and Crafts, and an artist, the workshop presented an exciting opportunity to merge his two passions. "I discovered the Makerspace during Wintersession and immediately saw its potential for my research," he said.

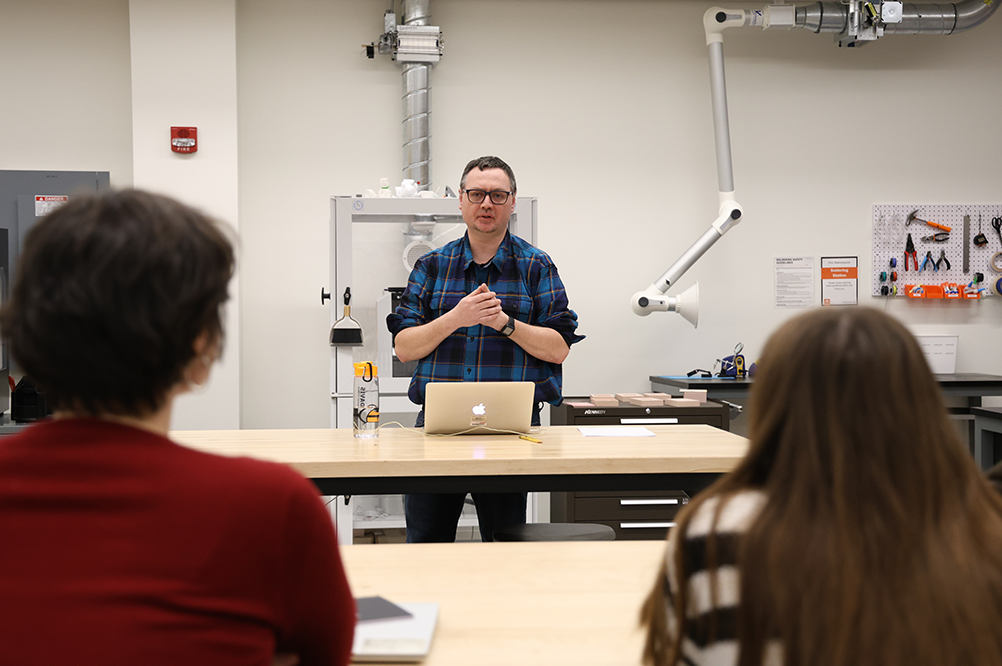
Bertrand Reau gives a talk on his data physicalization in the PUL Makerspace. Photo credit: Brandon Johnson
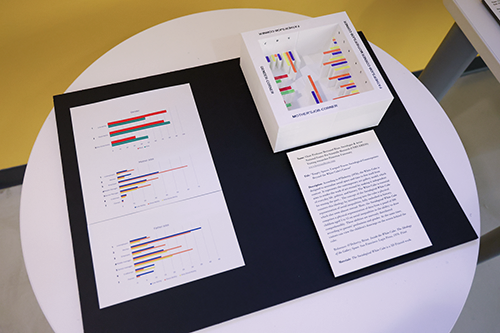
Reau’s project involved using original research material—300 children's drawings—to create a tangible work of art that represented inequalities in children's artistic practices. "The aim was to code the drawings to generate statistical data representing inequalities in children's artistic practices, indicating factors of proximity or divergence to school expectations of artistic activities," Reau explained.
“Subsequently, the interaction between the creation of the sociological white cube and the data prompted reflection on producing a novel object that engages and disseminates scientific knowledge [and a reflection on the] transversal logic between social sciences, art, and the use of data facilitated by the Makerspace,” Reau added.

Bertrand Reau’s data physicalization on display at the PUL Makerspace. Photo credit: Brandon Johnson.
Participants like Reau were encouraged to leverage their hobbies and interests when deciding how and what to make. "We had a wide variety of materials available in the Makerspace," said Ackerly, including 3D printers, looms, and paints.
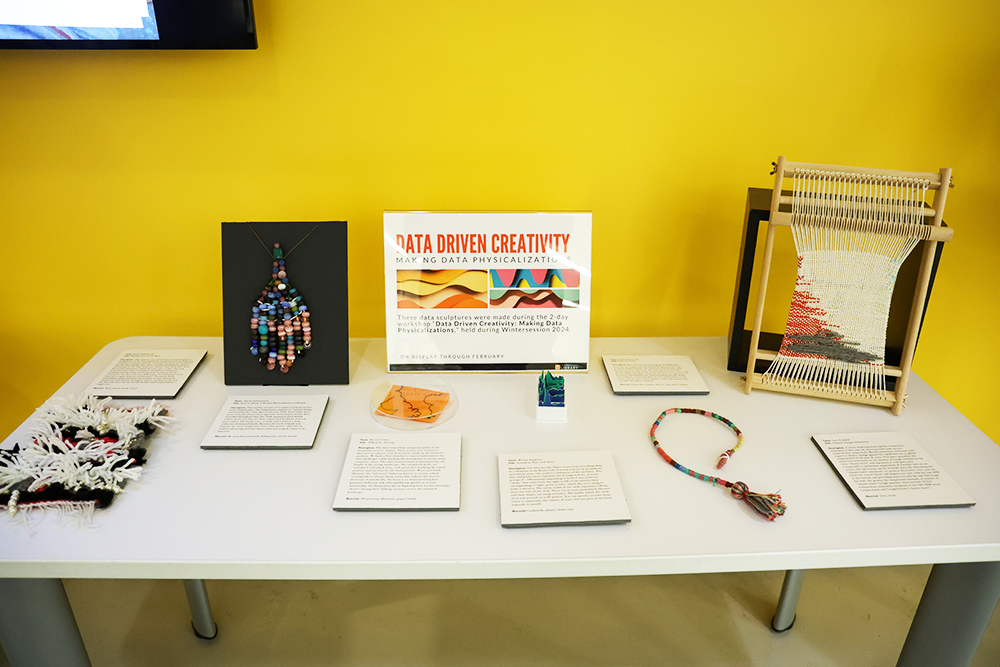
Reiff Conell, for example, used yarn to plot the walk between Firestone Library and Lewis Library based on the types of trees found along the stretch. Another participant used beads to chart the first seven days of 2024 and chronological health data recorded throughout each day.
"Everyone brought fresh ideas and created a wide variety of objects that represented data in creative ways," said Reiff Conell. From woven representations of climate change to animal response to sound, each physicalization told a unique story.
But the workshop wasn't without its challenges. "Creating 3D data visualizations requires a different way of thinking and interacting with data," explained Schwartz-Soicher. Reiff Conell and Ackerly also faced challenges in preparing for the workshop, such as finding the right medium for data or determining the scale for a given dataset.
Despite the challenges, the workshop was a resounding success. "All of our participants were enthusiastic, and most of them had a stake in their physicalizations because they were using their own data," said Ackerly.

An assortment of data physicalizations on display at the PUL Makerspace. Photo credit: Brandon Johnson.
Looking ahead, the organizers are figuring out how they might offer future sessions. "If we offer this session again, we may slightly change the order of the activities and allow more time for participants to use the Makerspace," said Schwartz-Soicher. “The goal is to continue fostering creativity and innovation in data representation, empowering researchers and artists alike to push the boundaries of what's possible, and to think differently about research communication.”
Reau, inspired by the Wintersession, already has a workshop of his own in the works. "I'm collaborating with a Princeton school to launch a workshop using LEGO bricks to introduce children to sociological analysis," he shared. "It's about bringing together art, science, and education in a way that sparks curiosity and inquiry."
Published on March 13, 2024
Written by Brandon Johnson, Communications Strategist
Media Contact: Stephanie Oster, Publicity Manager
Newsletter
Subscribe to Princeton University Library’s e-newsletter for the latest updates on teaching and research support, collections, resources, and services.
